


Information from data is the backbone of any business that needs to utilize truth-based independent decisions and influence the force of data to change the business towards growth and profitability. Data quality plays a very vital role in making the right decision. The most significant obstruction for any organization in making the correct decision is the accessibility and nature. Typically, data is stored within a company either in a data warehouse or in the cloud. Each business process that the company works on produces a lot of data, and based on these data insights; specific requirements are met. Ideally, a lot of possibilities are there when the underlying dataset can create insights, but most of the system-generated data are not clean, which makes the process of creating a competitive advantage for businesses very intricate.
Also Read: Microsoft Build 2 2022 Conference Highlights
Data Cleaning
Data cleaning is viewed as the most troublesome, tedious, and costly assignment in the BI world. There have been estimations by specialists that 60-80% of the total time is utilized for data cleaning in a typical analytics project. These projects include incomplete datasets and are derived from complex systems; their business has underlying structural inconsistency and sometimes a skillset barrier. In a Harvard Business Review article, Thomas Redman estimated that insufficient data costs US companies around $3 trillion per year.
(Fact Source: https://www.sigmamagic.com/blogs/data-cleaning-best-practices/)
Fundamental Problems in Data
The following types of problems exist when referring to bad data (inconsistent, does not meet the primary constraints, unit of measure of values is wrong):
Missing Data: This is a problem when the insights that must be produced are not properly in line with the system that is generating the data. For example, if the system is legacy and it produces a form for capturing data, there supposedly would be some fields that are not required, but later, if insights have to be created on those business functions, then there is a problem.
Insufficient Data: If the system that captures the data is not designed to collect information about the analysis that has to be done, maybe because the data was collected for some other reason. It is always bad to make a business decision based on partial data/information, which in turn will have a negative impact.
Bad Structure: This is any data with duplicate records, outdated information, and bad quality, which may include the dataset not being BI friendly. For example, the system created a dataset with wrong data types for some features and samples that are repeating or even shifted horizontally or vertically, which will ruin the analysis overall.
Incorrect Data: This is one of the most common issues in the dataset and an essential piece of the cleaning. These types of errors are hard to identify as the error could be a definitive mistake created manually or any errors which are caused due to data generated from a system or from an instrument. Overall decides the accuracy of the analysis that is derived from the data.

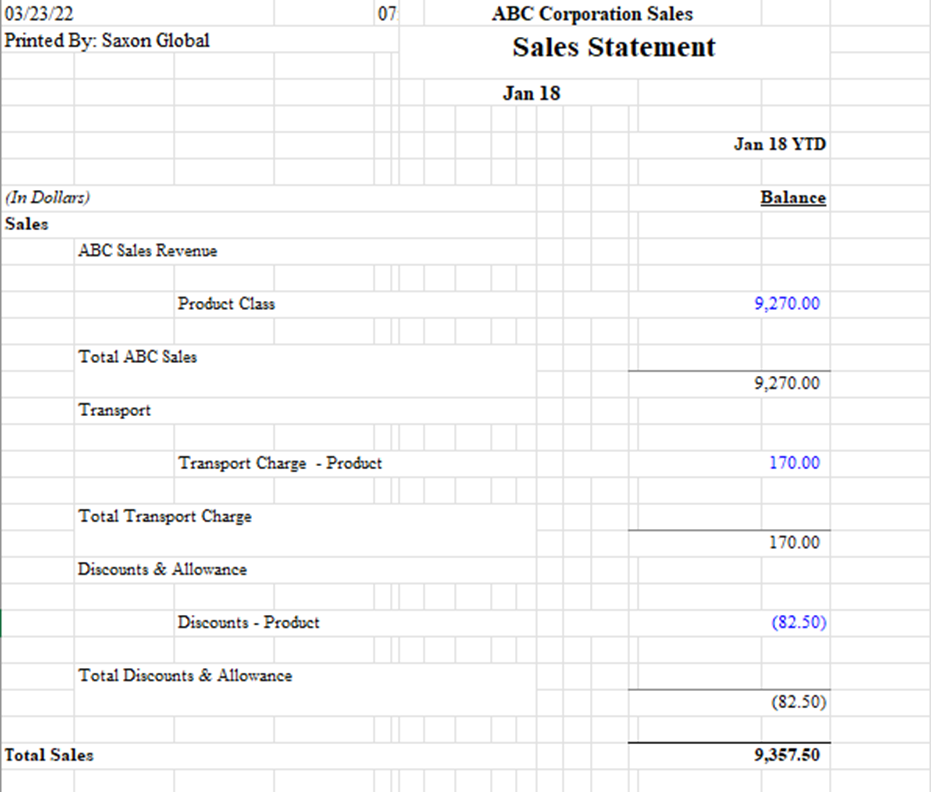
Here, the above figure is an example of bad data. The above data is informative; reading the information from this figure is very easy. But the focus is not on the data being very comprehensible; rather, it must be BI friendly. Some basic data cleaning steps that need to be applied here are removing the top few rows, as those rows do not include any analytics sample.
We need to separate columns based on category and subcategory, and all the other column with blank or no information needs to be removed.
Power Query as a Data Cleaning Tool
Power Query is a powerful data cleaning, connection, shaping technology that is a core part of the Microsoft Analytics Business Intelligence tools. With power query, data cleaning is transformed and automated, which gives time for analysis and provides solutions for business impact. Analytics is correct with accurate data, so Power Query could be used to extract data from various sources, transform it to suit the needs/business function, and load it to the required destination.
To give you an example of Power Query and its capability, I will show some applied steps that have been done on the above figure to improve data quality for reporting and insights.

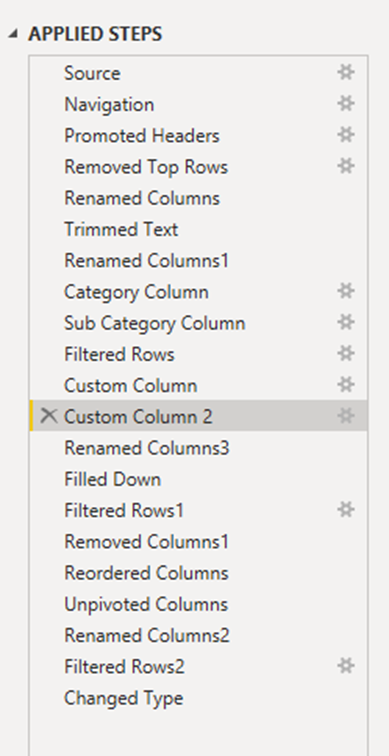
The first few steps are basic connections, setting up the source location, defining the headers for the dataset. The current column that exists now is given a proper name based on the features that they possess. Apart from all these basic initial steps, the most important beginning of the cleaning process is defining the data types properly. The Category Column and Subcategory Column are the steps where basic logic is applied to identify the category rows and subcategory rows. The logic here is to create differentiation among all the rows, which could be based on any criteria that match your definition. In this scenario, these two steps were crucial in the transformation as creating a dynamic logic was very difficult.
If you see the dataset in excel, you will know that the differentiation could be the fact that the indentation is provided different to different rows based on the category and subcategory, but when we import the dataset to Power BI, the indentation and the way dataset is defined in Excel changes even if it possesses the same information but the structure overall changes. So, this is a perfect example where we can say that Power Query is necessary as we have to do all the cleaning and transformation once we are already on the analytics tool. The next steps include row filtering, which is to clean the redundant information. Filtering is an important step in the transformation as it directly removes the unwanted samples from the dataset. The last and one of the most important steps was doing the Unpivot function. The better-defined columns as samples should not be kept as features. This way, the size of the dataset keeps on increasing, but the data format is very friendly for BI and developing different solutions for business analytics.
All the above steps that have been applied to the raw data are always remembered. Any step could be changed as well, depending on choices. So, what it does is it simplifies the whole process of data cleaning and automates the process for further cleaning on any new day with the same sets of raw data.
Best Practices for Data Cleaning
- It is always necessary to keep track of the data types defined according to the business function. Ensuring that the data types are used and stored in the source as much as possible is essential.
- Removing all the duplicate rows before starting any analytics project is the key to creating an accurate insight that will further ensure a positive business impact.
- Thinking about the data in the most holistic way possible, both the developer and the person who is deriving results from the insights should be kept in mind.