

Speed is defining everything for business in this digital era. Data is exploding everywhere, and companies are focusing on bringing in more agility in their insights process. Low-code, Artificial Intelligence and Machine Learning are transforming every business process. How about leveraging them to drill down your dashboards and make them more attractive? Can Artificial Intelligence in Power BI enable speed and insights for everyone? Users can leverage Artificial Intelligence in Power BI to explore data easily, answer your data queries, and observe patterns faster than before.
Pre-built AI is now accessible in many areas in Power BI to empower everyone for advanced analytics. These new AI features are easy to use for data scientists, BI professionals, data analysts and data modelers. In other words, these can be termed as self-service AI capabilities for sophisticated data modelling and faster impactful insights. Power BI is no longer about simple dashboards for your business but about flexibility, interaction, intelligence, and insights to bring in agility.
What are the new features of Artificial Intelligence in Power BI?
- Image processing and text analytics
- Key driver analysis to drill down about the key business metrics in the dashboards
- Automatic Machine Learning Models – pre-defined and customized
- Automated Insights and Q&A
Let us explore each of them in detail:
Microsoft AI Visuals – Power BI
Are your questions answered with the dashboards? Do you still think you need more analysis of your dashboard? The new Artificial Intelligence in Power BI analyzes your numerical and non-numerical data as well. We will look at some AI-powered visuals and their usage in Power BI:
Key Influencers
Key Influencers in Power BI, a pre-built AI visual, helps analyze key drivers that can influence your KPIs. It is more important to see the drivers in visuals in multiple plans than taking 2 or 3 minutes to pull the data and create another BI report. At times, it is time-consuming and prone to errors when you pick up the data and analyze it. For example, let us look at the factors your customer churn. Key Influencers visual provides the details about repeat and first-time customers and analyzes them by factors like location, age, gender, income, and many more. The Microsoft AI Visuals in Power BI looks like this:

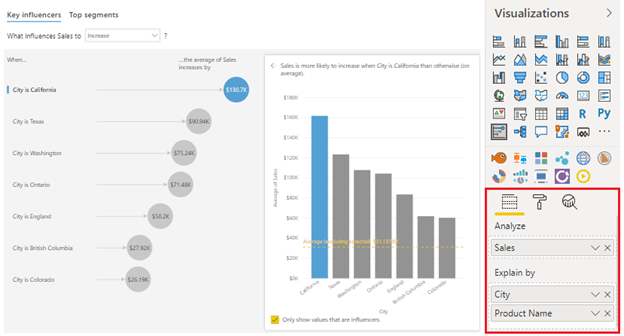
Another important feature under the Key Influencers in Power BI is the ‘Top Segments.’ Using the cluster analysis, you can visualize how multiple factors can influence the KPI. In the above example of customer churn, the rates could be different for many products in your organization, details about that can be visualized in Top Segments. The feature is available for review in the public domain, and you can find more information here.
Decomposition Tree
Data aggregation is a more significant challenge to visualize your data as per the dimensions. Building different visuals for each of them is time-consuming. With Decomposition Tree, a pre-built capability, you can automatically aggregate the data and drill down and view into your multiple dimensions in the report. Let us take the example of sales data from your records. You can add the dimensions like City, Country, Product, and any other that you need to your dashboard in simple clicks. Users are enabled with simple data analysis for these dimensions like increase or decrease (high and low values). These are options are called AI splits and the result for high-value AI splits look like this:

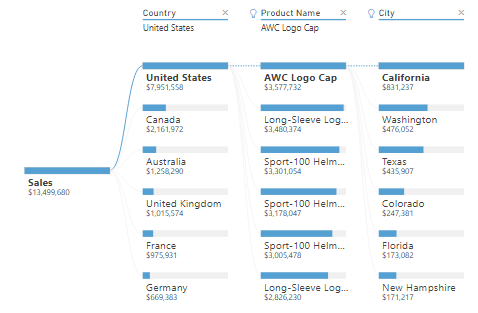
Source – Microsoft AI Visuals documentation
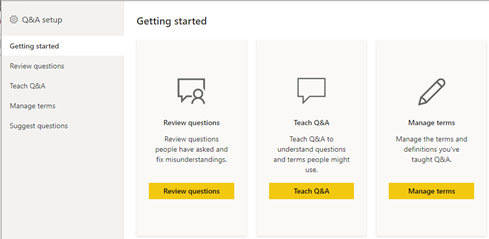
Q&A Visuals
What if your questions in a plain language get addressed by the dashboards? The Q&A feature allows users to ask natural language questions related to the data, and then it fetches the answers for those questions from your reports. At times you may face challenges using similar words in your question for the same report. Can Artificial Intelligence in Power BI address such issues? You have the option to define similar terms in your Power BI panel. Like you want to look at Sales by country, you can add dimensions like area and region to deliver the best results.
If your users are asking the same questions from your Sales report, you can pin the visual or keep the Q&A as a visual for easy access. For example, consider sales report, Q&A visuals answer broad questions like Sales by country, product, gender and factors like this without your users going back to the report’s multiple times.

AI-powered analysis
Does it sound interesting to learn more about the underlying story from your dashboards? Rather than just observing the growth and decline in your sales, you get more value from the dashboards if you can understand its reasons. AI-powered analysis within traditional visuals provides you with the much-needed answers for your data queries. You can also uncover insights when your distribution varies. Often in your dashboards, distributions are not the same for various categories. Without wasting much time on the answers, Power BI provides you with the explanation in a few clicks.
Smart narratives provide you the much-needed impetus to quickly summarize the reports for your target audience. You can leverage this feature to outline your reports, trends, and key takeaways that can be customized too.
Our accelerator InsightBox for Power BI also saves a lot of your efforts to create dashboards for different KPIs and industries in hours.
Azure Cognitive Services
With Azure Cognitive Services, you can leverage pre-trained machine learning models for faster insights. Users can apply different ML algorithms to both structured and unstructured data during the self-service data preparation. Currently, users can leverage these pre-trained models for their text and image datasets for more insights.
- Extraction of key phrases
- Image tagging
- Language detection
- Sentiment scoring
The most popular use case with these models is to perform text analytics and review the sentiment scores. Every business now seeks customer feedback analysis; analyzing the text automatically gives the necessary edge to react instantaneously.
AI Modelling with Azure Machine Learning
The low-code AI capability, Azure Machine Learning, enables users to leverage machine learning models in a simple drag and drop interface. Users can customize the models, run training experiments, and then deploy them to Power BI. How does it add value?
- You will not require a data scientist to run the models; analysts and domain experts can do it without any assistance
- No more coding; you can train your model within Power BI
- Performance reporting with Power BI’s dashboards and visualizations
Once you evaluate, train, and customize your ML models, you can apply them to your future data sets for faster insights.
Agile Insights
Q&A feature powered by natural language processing is unique to Power BI, and it allows you to get your needed insights in no time quickly. Apart from this, once you update the data in Power BI, you have a Quick Insights feature that runs various algorithms to identify trends in the data. This feature enables you to get a few dashboards without much effort.
Power BI is not just a reporting tool anymore, and it is the go-to for your analytics, automation, and conversational AI needs as well. Every feature that is updated in the new releases is aimed at adapting to the latest technology trends. For any of your business challenges, Microsoft Power Platform provides you with a rapid solution.
Are you interested in more AI services for your business? Our AI services offer you the best ROI in no time. Get in touch with our experts for more information.