


Business intelligence (BI) is an amalgamation of data tools, data visualization, data mining, business analytics, and best practices to help organizations implement decision intelligence. You can achieve modern business intelligence by crafting a comprehensive view of an organization’s data. The insights will help organizations remove inadequacies, drive changes and swiftly adapt to market changes.
BI can help organizations make better decisions by showing contextual data, both current and historical data. Analysts can utilize BI to offer excellent data stories and benchmark competition for better efficiencies. Furthermore, BI can quickly identify market trends to increase sales, revenue, or operational efficiencies. Business intelligence can provide immense opportunities to help companies make smarter, data-driven decisions.
The market has tons of BI tools that organizations can use to power their Decision Intelligence system. Microsoft has been investing heavily in Power BI for information processing to create understandable reports and update dashboards and reports in real-time. The adoption of Power BI is touching new heights, Power BI is a clear leader in cloud-based business intelligence and data visualization ecosystems.
Microsoft is providing the following elements and several others that work collaboratively:
- Power BI Desktop: Tool used to develop a data model and reports. This tool is supported on Windows, Mac, and mobile devices.
- Power BI Service: It is a cloud-based service that helps create reports and dashboards, which you can share with end-users in the Power BI Service and mobile devices to view and interact with them. Power BI Service also enables you to control how you share your work. It allows the creation of workspaces where you and your colleagues can collaborate on reports and dashboards.
How to connect data in Power BI?
Apart from out-of-the-box supported connectors to get your data in Power BI, creating custom connectors is another option to create your connector if the connector does not suffice. Power BI Desktop provides the ability to create custom connectors and use them when connecting to the data source. This feature opens doors to many possibilities. A custom connector enables you to create a component that can be re-used. You can use Visual Studio with M script to create custom connectors. Microsoft BI supports the following connectors out-of-the-box. Microsoft supports importing data from popular databases and services into Power BI using various file formats. As a part of the robust ETL process, you have to clean and transform the data once you get it imported from the selected source. Loadable tables will then be edited and based on their columns, create calculated columns and measures — this way; you can convert arrays of information into data sets with the structure necessary to build a visualization.
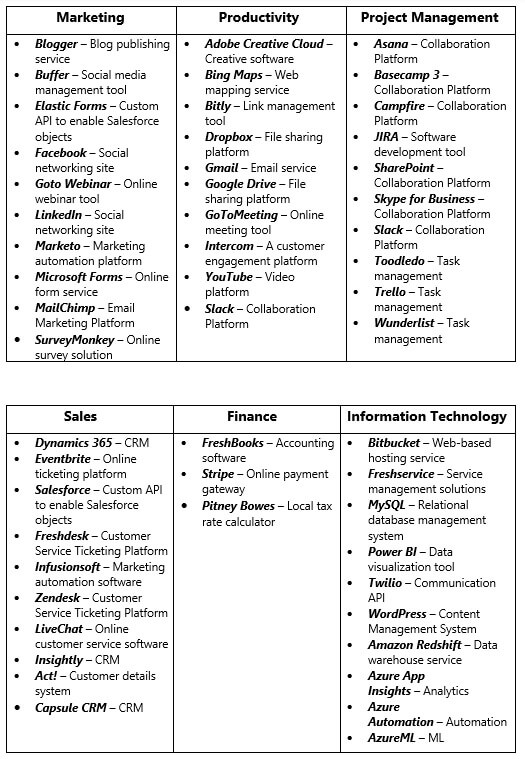
A few Out-of-the-box Connectors

Architecture – A few details
It is necessary to create and follow proper architecture to drive your data engineering projects or relook at existing architecture to ensure scalability, extendibility, and performance. We suggest the following architecture, which is cloud-agnostic and considers the above parameters for better visualization.

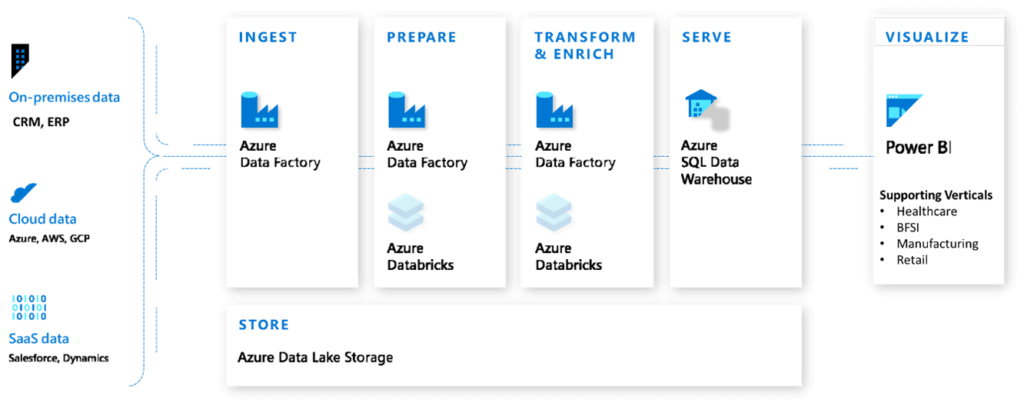
On the leftmost side, you will have your data sources. Data source and data set are different concepts but partially overlap in the architecture. The data source is the final path to the information you want to work on. The path to the file on the hard disk, the Salesforce API URL, or the database’s location in the cloud – all this is the way and the data source.
The Data set is a collective of the data source, the data, and the Power BI account that connects these data sources. Whenever users connect to the data, Power BI automatically creates a data set which is further used to create reports and visualizations.
The data is ingested through the Azure Data factory using out-of-the-box and/or custom connectors to either Azure Data warehouse or Data Lake. As the solution is cloud-agnostic, we mostly explain the Azure cloud process. If you are dealing with big data, then Azure Databricks allows you to process large data workloads. These workloads enable collaboration between data scientists, data engineers, and business analysts to derive actionable insights with a one-click setup and streamlined workflows.
The data needs clean-up unless you have unstructured data. The cleaned and massaged data will help you to enhance your data visualization for perfection as far as possible.
Once you have data in place, using Power BI tools, which are very user-friendly, you can build required dashboards and reports. You can find various chart types out of the box, but additional chart types or visualizations can be customized to provide the necessary visual treatment.
As you can see, with the right amount of knowledge, compelling and valuable analytics using Power BI can be pulled from a diverse number of data sources. However, it can get even better than that with “Content Packs.” “Data packaging” is incredibly convenient.
We provide starter packs for various business domains to help fast-track projects and Go-To-Market. Are you interested to know more about Power BI? Get in touch with our experts for more information.