
Most leadership teams have dashboards that show how the business is performing. Yet a question as straightforward as “Why did revenue dip last quarter?” can still take days to answer, as teams gather information across functions and investigate the causes. Leaders need the ability to ask, explore, and understand- when the question arises.
That’s the core of the enterprise dashboard vs business intelligence dashboard question. While both help to visualize data, there are certain differences between the two based on their users and end purpose. This guide breaks down the differences, when to use each, and what to consider before choosing.
What Is an Enterprise Dashboard?
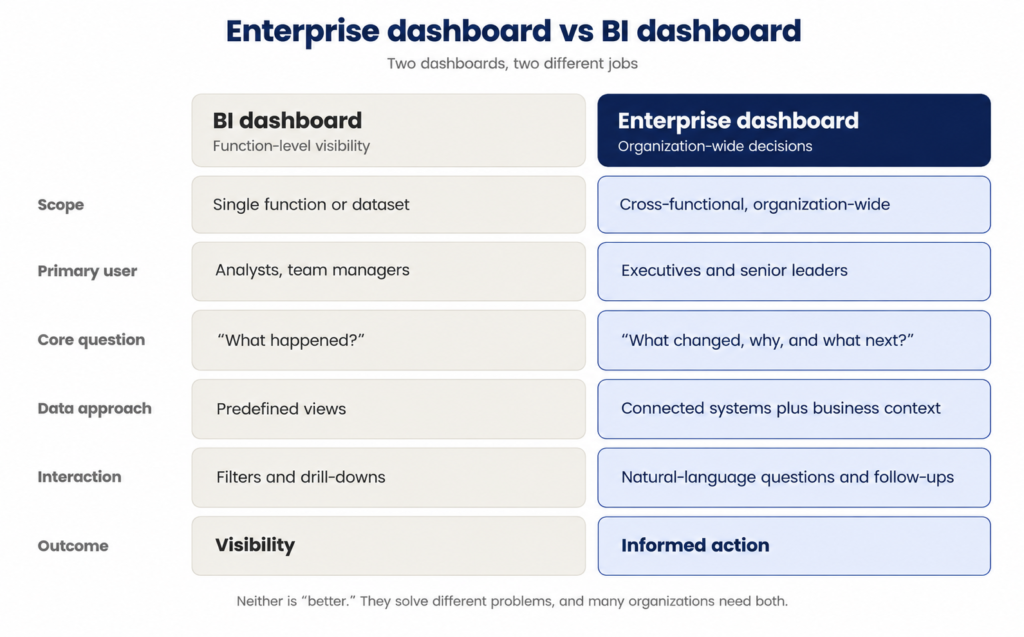
The enterprise dashboard provides a broader perspective. It brings together information, KPIs, and trends in an organization to present a holistic view of the business as opposed to having piecemeal reports from various parts of the business.
An enterprise dashboard for executive decision-making typically brings together:
- Finance, sales, operations, supply chain and HR data in one place
- Business rules and shared metric definitions
- Exception alerts and cross-functional signals
- Context that explains results, not just displays them
What Is a Business Intelligence Dashboard?
A business intelligence dashboard is a view on the screen with metrics, gathered from one or multiple sources of data and displayed using charts, tables, and KPIs. The sales dashboard will feature metrics such as pipeline, win rates, and sales per region, while the finance dashboard can include metrics related to cash flow and budget variance.
A BI dashboard is excellent at:
- Visualizing predefined metrics
- Letting analysts filter and drill into specific datasets
- Giving individual teams a fast view of their own performance
Its limits show up at the leadership level. BI dashboards are typically built for a defined question, within a defined function. When a CEO asks something cross-functional, the answer often means stitching several dashboards together by hand.
Table of Contents
Enterprise Dashboard vs BI Dashboard: Key Differences
Why the Gap Matters for Business Performance Management
Business performance management means measuring the right KPIs, finding gaps against goals, understanding root causes, and taking corrective action. An enterprise dashboard for business performance management supports that full loop.
BI dashboards typically do a good job of addressing the first requirement, but rarely do they go beyond that to the second requirement. The root cause analysis and actions to take remain the responsibility of the analysts, who must spend hours reconciling inconsistent numbers between different systems.
The Next Step: Conversational Enterprise Dashboards
This is the gap platforms like Saxon AI’s CXO Control Tower are built to close. Instead of providing fixed insights, it allows the leader to pose the business question in clear terms, explore the changes, comprehend the underlying reasons, and then make decisions accordingly.
But behind this interface, it is linked to sources like SAP ERP, CRM, sales, ticketing, manufacturing in the factory, finance, and HR, and thus one study can cover all the departments.
Trust comes into play too: every response provides its data source, validates with the enterprise data, and shapes based on the user’s role and permissions. And this is what makes a partner different from a black box.
How to Choose Between an Enterprise Dashboard and a BI Dashboard
Ask these questions before you buy or build:
- Who is the audience? Team-level users generally fare well with BI dashboards, but executives generally demand a cross-departmental perspective.
- How departmentalized is your data? You benefit from an enterprise solution if the answers require pulling information from more than three systems.
- Is understanding necessary, or is just monitoring sufficient? Root-cause analysis favors an enterprise dashboard.
- How well defined are your metrics? Conflicting metrics sap the credibility of any dashboard.
- Is your data foundation ready? Governed, well-structured data underpins both. Saxon’s data services help build that foundation.
The Bottom Line
BI Dashboard gives you the figures. Enterprise Dashboard enables you to comprehend them and act. If decision makers are spending more time reconciling the figures than making decisions, it might be time for you to move away from the conventional dashboard.
Ready to see it in action? Explore Saxon AI’s CXO Control Tower and see how a question becomes a clear course of action.
Frequently asked questions
No. There are many instances where companies have kept their BI dashboard in place for functional reporting while incorporating an enterprise dashboard for investigative work at an executive level. An enterprise dashboard does not replace an organization's BI but is an additional tool.
ERP systems like SAP, CRM systems, financial systems, HR management systems, ticketing systems, and manufacturing/production data. This will depend on the specific platform, so check that out before you choose the right one for you.
By integrating information from all departments and presenting the data in a unified view, the leadership team will be able to understand how sales, operations, finance, and supply chain influence each other rather than seeing them independently.
Consider your audience, data silos, need for root-cause insight, metric consistency and data readiness (see the checklist above).
It will gather all the KPIs, trends, and exceptions; it will show changes and deviations from the targets and let you ask questions to discover the root causes, without needing to wait for a tailor-made report.