
CXO Control Tower: Your AI-Powered Enterprise Decision Partner
CXO Control Tower brings information across your enterprise together, so you can investigate issues, understand what’s driving them and determine the next step– without waiting for reports or coordinating across teams.
CXO Control Tower: Your AI-Powered Enterprise Decision Partner
CXO Control Tower brings information across your enterprise together, so you can investigate issues, understand what’s driving them and determine the next step– without waiting for reports or coordinating across teams.
- faster executive analysis
- less time from question to insight
- functions/data sources connected per investigation
From Days of Reporting to Minutes of Insight
Static Reports
- Fragmented data across systems
- Manual data pulling delays decisions
- Time Taken: 4-5 Days

CXO Control Tower
- Unified, traceable answers
- Real-time, AI-assisted responses on demand
- Time Taken: 5-7 Minutes
Scattered Data? Slower Decisions
Getting a complete picture often means piecing together information from multiple sources.
- Critical information is siloed and hard to retrieve
- Disconnected views of performance
- Data spread across functions
- Different definitions of key metrics
- Traditional data consolidation takes 2-3 days
The result: opportunities are recognised too late to act on.
Clarity for Every Business Decisions
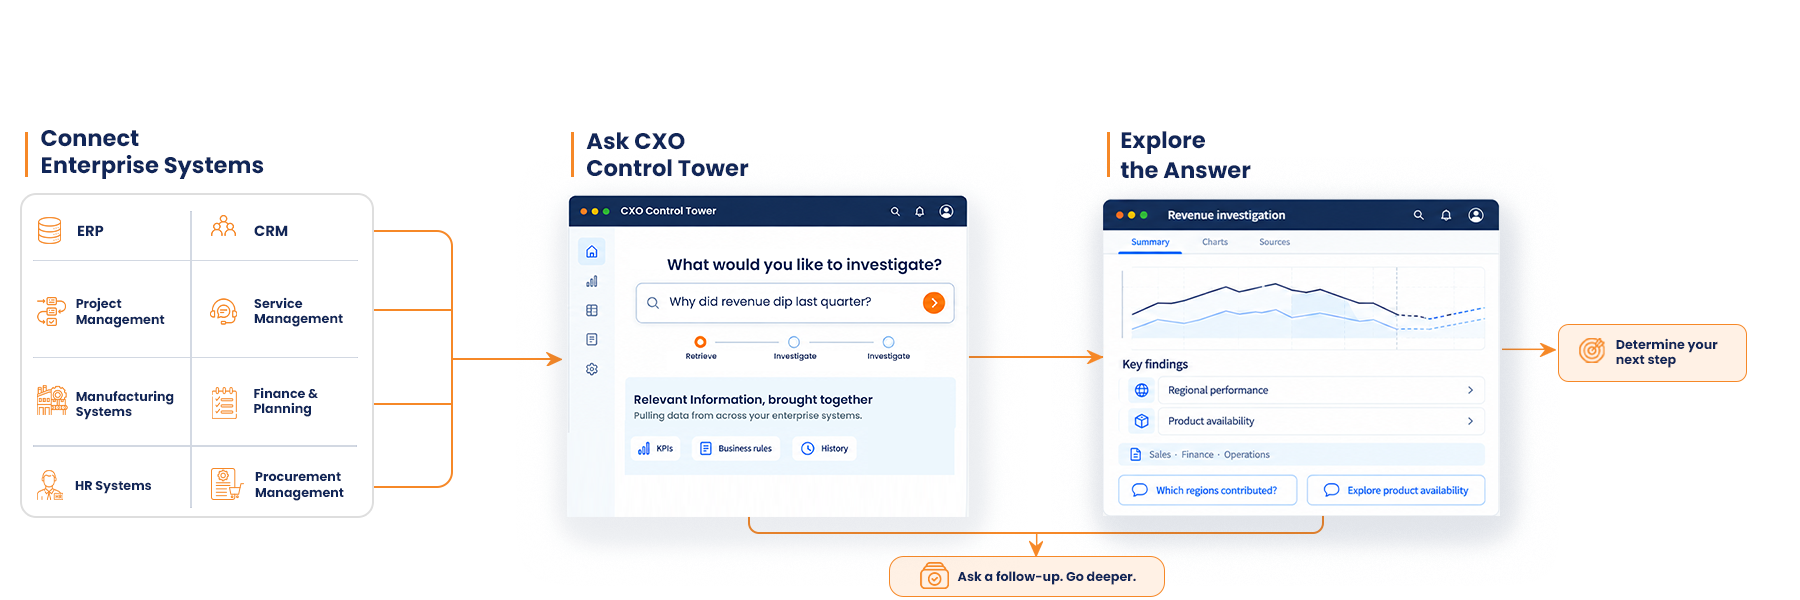
CXO Control Tower draws on relevant data across enterprise systems, understands the context of your question and delivers tailored answers to support informed decisions.
Clarity for Every Business Decisions
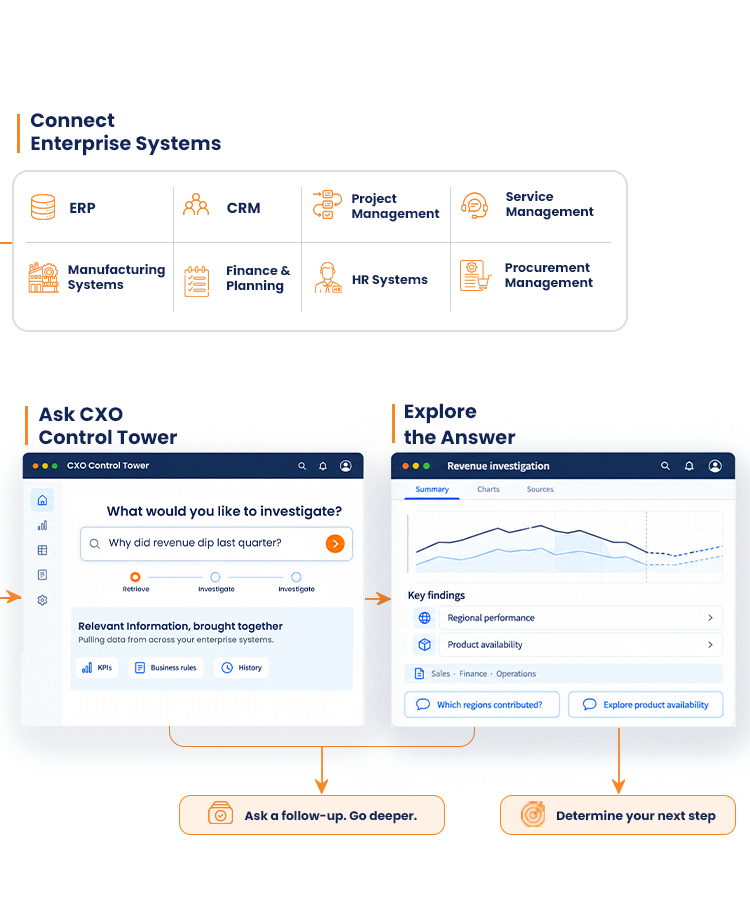
Go deeper into your data. Decide with confidence.
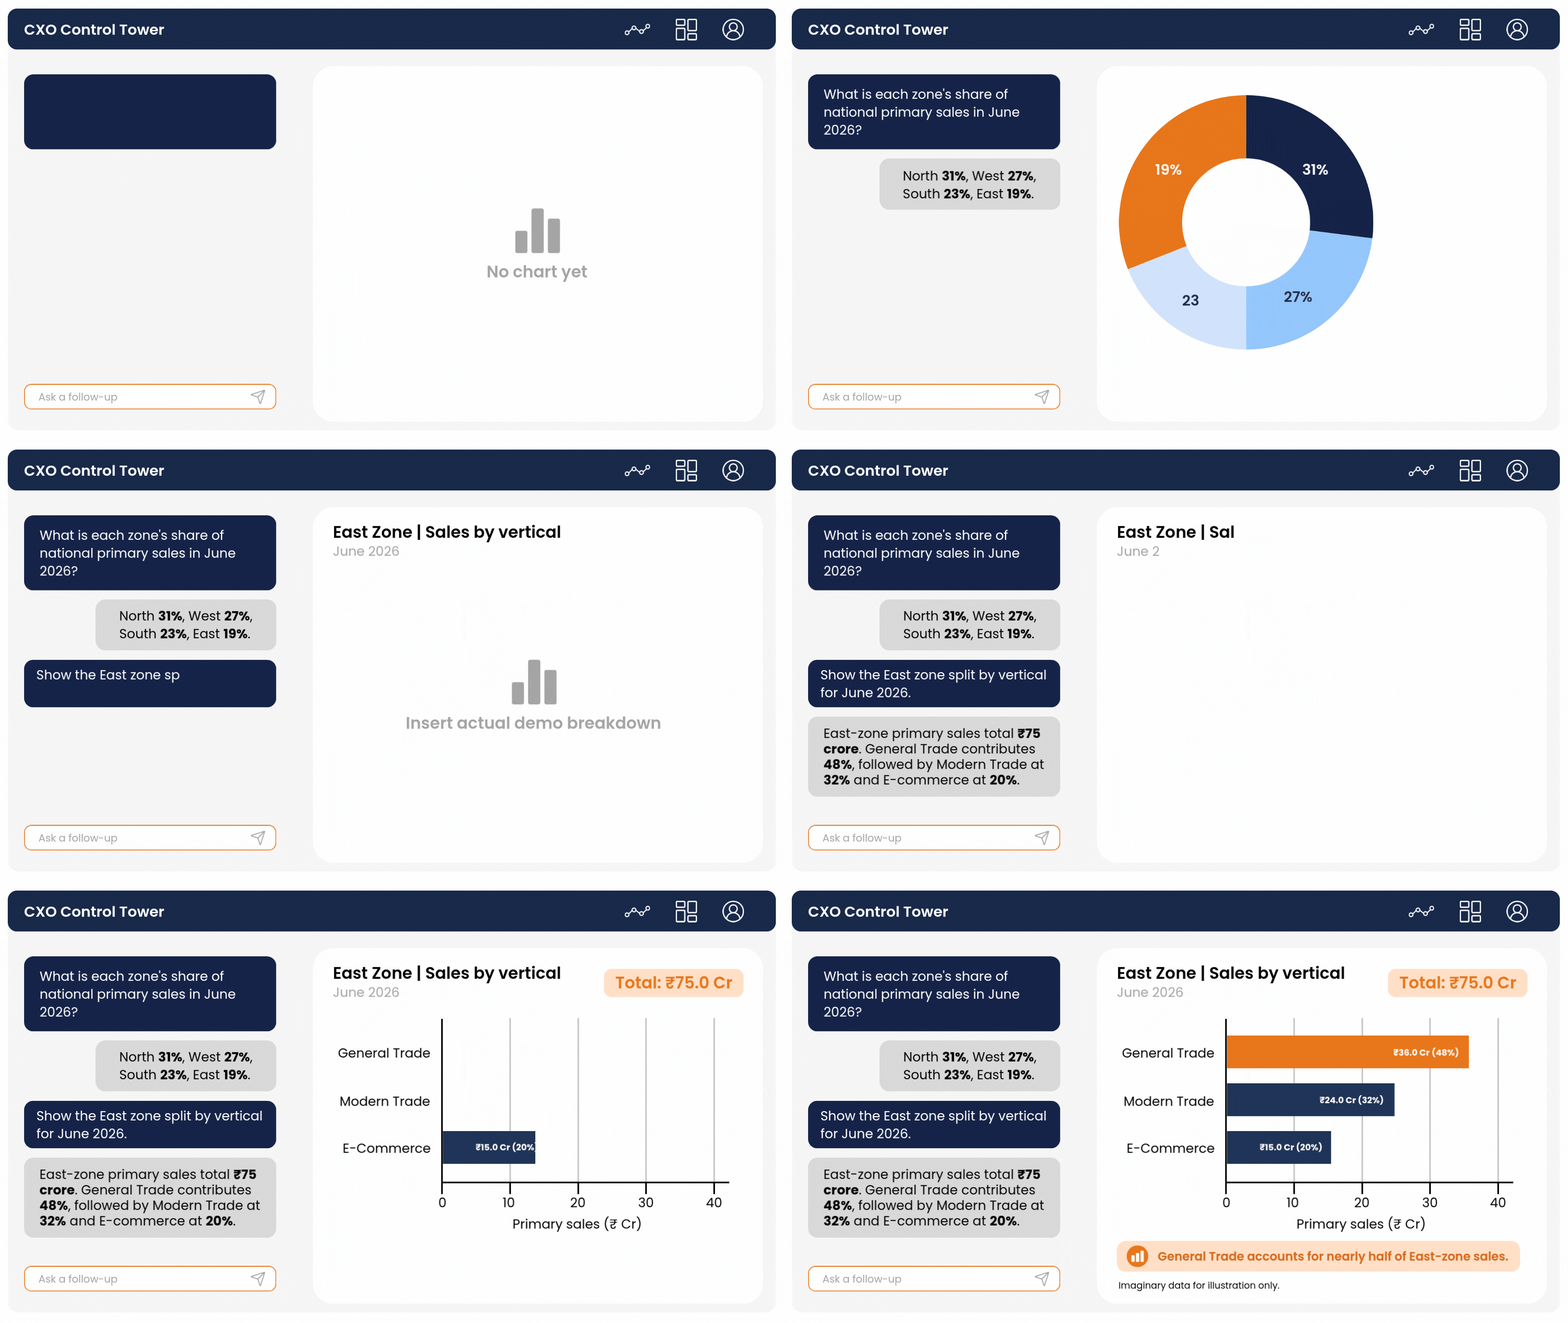
From a Question to a Clear Course of Action
CXO Control Tower brings relevant enterprise data and business context together, allowing leaders to ask questions, investigate performance, and understand what is driving change.
Leaders ask business questions through a conversational interface.
Explore the data and ask follow-up questions to understand what changed.
Identify drivers, patterns, relationships, and business context behind the result.
Use insights, visualizations and recommended actions to determine where attention or action is needed.
Ask
Ask business questions in natural language.
Investigate
Explore the data behind the change.
Understand
Identify drivers, patterns and context.
Decide
Turn insights into informed action.
01
Ask
Ask business questions in natural language.
02
Investigate
Explore the data behind the
change.
03
Understand
Identify drivers, patterns and
context.
04
Decide
Turn insights into informed
action.
Performance & Revenue Intelligence
Revenue Performance
Sales Performance
Customer Intelligence
Product Intelligence
Regional Performance
Pricing Intelligence
Revenue Performance
Sales Performance
Customer Intelligence
Product Intelligence
Regional Performance
Pricing Intelligence
Predictive & Risk Intelligence
01
Risk Indicators
Signals that may indicate operational, financial or business risks
02
Performance Exceptions
Signals that may indicate operational, financial or business risks
03
Cross-Functional Signals
Relationships between operational, financial and business performance
04
Predictive Insights
Potential outcomes and emerging patterns based on available data
Predictive & Risk Intelligence
01
Risk Indicators
Signals that may indicate operational, financial or business risks
02
Performance Exceptions
Unusual changes, deviations and areas requiring investigation
03
Cross-Functional Signals
Relationships between operational, financial and business performance
04
Predictive Insights
Potential outcomes and emerging patterns based on available data
01
Risk Indicators
Signals that may indicate operational, financial or business risks
02
Performance Exceptions
Unusual changes, deviations and areas requiring investigation
03
Cross-Functional Signals
Relationships between operational, financial and business performance
04
Predictive Insights
Potential outcomes and emerging patterns based on available data
Built To Understand Your Business
Connect business data with the context needed to understand it.
Verified and Traceable Answers
Responses are validated against enterprise data, and each one displays its data sources so insights can be traced back to their origin.
Deeper Analysis
Go beyond the initial answer to understand drivers, relationships and what the findings mean for the business.
Personalized Experience
Responses and insights are shaped around the user’s role, access and business context.
Business Guardrails
How the organization defines and evaluates performance
Historical & Predictive Analytics
Past trends and emerging patterns based on available data.
CONNECTED TO YOUR ENTERPRISE
The systems you run. The answers you need.
CXO Control Tower connects your existing applications and data platforms, giving leaders a complete view of the information behind each business question.
Explore Connections across platforms such as
SAP
Oracle
Microsoft Dynamics 365
Salesforce
Snowflake
Microsoft SQL Server
Databricks
PostgreSQL
See What’s Changing. Understand What It Means. Act While It Matters.
The CXO Control Tower brings together the relevant numbers, operational updates, and business context- to show what has changed, what is driving it, and where leadership attention is needed.
Frequently Asked Questions
CXO Control Tower is a conversational executive intelligence platform that helps leaders monitor performance, investigate business questions and understand what is driving change. It connects information across enterprise systems to provide cross-functional business insights.
Traditional BI dashboards provide predefined views of business performance. CXO Control Tower allows leaders to ask questions in natural language and investigate the factors, relationships and context behind those results.
An enterprise dashboard refers to an integrated view through which enterprise data, key performance indicators (KPIs), trends, and performance data can be consolidated for making decisions. This dashboard can help in connecting data from various functions and systems, thereby helping business managers in analyzing performance, identifying changes, and knowing areas where investigation can be done.
Enterprise dashboard provide managers with an overview of all business information without having to navigate from one report to another. The executive dashboard for business executives combines all KPIs, trends, exceptions, and business context, so that changes can be monitored and investigated instantly.
Business Performance Management is the measurement, analysis, and optimization of business performance relative to organizational strategy and activities. Business Performance Management includes measurement of appropriate KPIs, determination of any gaps that may exist between actual and desired performance, understanding the root causes of such gaps, and taking corrective measures.
In Business Performance Management, the dashboard contains the KPIs, goals, trends, and results from various aspects of the business all at once. The use of a business performance management dashboard aids in identifying differences, comparing performance in various functions, understanding causes, and making decisions.
The correct KPIs will vary based on organizational goals and the sector it operates in. Some common categories of KPIs that can be found in an enterprise dashboard include financial KPIs such as revenue, sales, and profit margins, manufacturing KPIs such as production and inventory, customer KPIs, working capital KPIs, supply chain KPIs, and operations KPIs.
Enterprise dashboard provide a more comprehensive view of how a company performs in terms of departments, systems, and organizational levels. On the other hand, business intelligence dashboard are mostly used for analyzing already defined data. Enterprise dashboards have been enhanced to combine the two aspects of business intelligence and contextual analysis.