
Data-driven decision-making (DDDM) in a business is easier said than done. Your DDDM process should have two important characteristics – quality and speed. However, for most executives, making quality decisions faster is still a challenge. In a survey, McKinsey found that only 37% of business executives make faster and quality decisions. CXOs face several challenges, such as data complexity, poor data literacy, etc., in extracting actionable insights from their data. To help you overcome these challenges, in this article, let’s explore how you can use data visualization together with generative AI.
Before that, let’s understand the challenges of driving a data-driven decision-making culture in your enterprise.
Roadblocks to data-driven decision-making (DDDM):
Data-driven decision-making is an approach to making strategic decisions based on data in line with your business goals and objectives. What’s driving businesses in this 21st century? It’s data, unarguably. Data is much more valuable to your business than any fossil fuel. An MIT Center for Digital Business study found that DDDM resulted in 6% higher profits for businesses. As a business executive, you need to go beyond thinking of data as the new fuel and implement solutions to drive a data culture. A PwC survey found that data-driven businesses make three times better decisions. However, the maneuver to achieve 3X improvement in decision-making throws some challenges at executives.
Here are some of the key challenges:
Data Complexity
The ever-growing volume of data and diverse data sources increase data complexity for executives and make it difficult to extract meaningful insights. Adding to this complexity is the variety of data types, including structured, unstructured, and semi-structured data. Unstructured data, like text, images, and audio, requires advanced techniques for analysis. Further contributing to this complexity are dynamic data streams – with their rapidly changing values, and high-dimensional data – with many variables per data point, further contributing to complexity.
Lack of data literacy
Data literacy is the foundation for data-driven decision-making. Not everyone is a data expert with the skills to understand, interpret, and utilize data effectively. You may struggle to interpret complex data sets and turn them into actionable insights. Lack of data literacy can lead to misinterpretation of data and result in incorrect conclusions. Eventually, you will make wrong or inaccurate decisions. Studies found that 73% of companies fail to extract meaningful insights from their data due to lack of data literacy. By fostering data literacy, you can empower your workforce to leverage data effectively, improving decision-making and business outcomes.
Poor data quality
Poor data quality is a critical challenge in data-driven decision-making. It occurs when data is inaccurate, incomplete, inconsistent, or outdated. When you use poor-quality data in your analysis, you will get inaccurate or incorrect insights, which will misguide your decision-making. For example, inaccurate customer data can lead to suboptimal marketing campaigns and decreased customer satisfaction. Poor data quality undermines trust in data and can impact various aspects of an organization.
Data security and privacy
Data security and privacy are critical challenges in DDDM. Security and privacy concerns arise when organizations struggle to protect sensitive data and comply with privacy regulations. Unauthorized access and data breaches can result in severe consequences, including legal penalties and reputational damage. Addressing these challenges requires robust cybersecurity measures, encryption, and clear privacy policies. Organizations must prioritize data protection and educate employees to maintain trust with customers and stakeholders while leveraging data for informed decision-making.
Data visualization + Generative AI – the power duo for a DDDM culture:
Can you read 10,000-row sales data on an Excel sheet and identify your sales trends?
Can you read through a hundred conversations on different email threads and map them to make a conclusion?
You need to have the bundles of data visualized beautifully and meaningfully so that you can get a complete picture of your data and communicate the same to your stakeholders. Because visual learning is very effective. In fact, a study by the Social Science Resource Network found that 65% of people are visual learners. Visual learners have a unique advantage when it comes to comprehending data presented in visual formats compared to information conveyed orally or in written form. This advantage often translates into better performance on tests and a deeper understanding of the underlying data.
In the early days of the data revolution, you would need to rely on your IT teams to get a granular-level view of your enterprise data. Today, you have sophisticated data visualization tools like Power BI that can connect to any data source and represent huge amounts of data in interactive visuals.
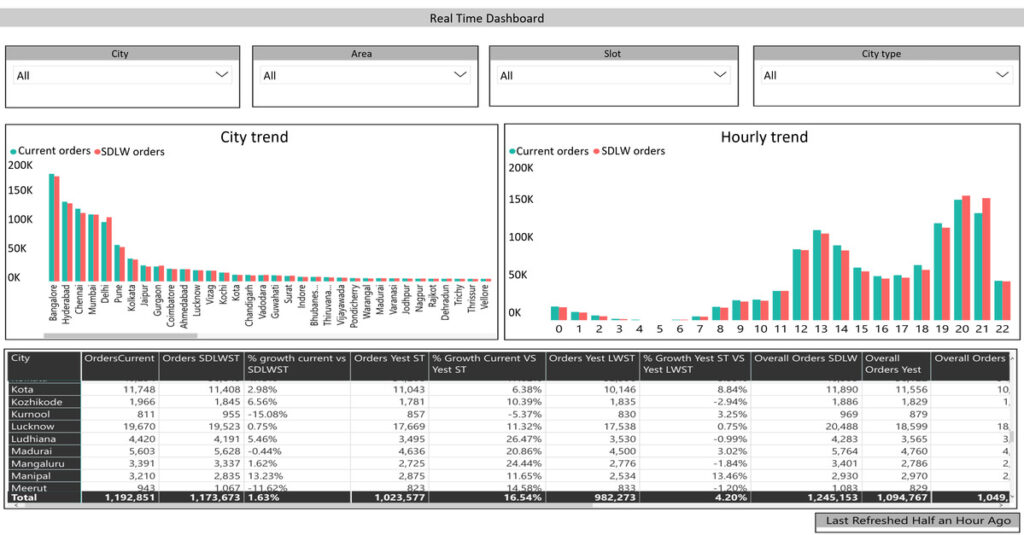
To better understand how data visualization helps in effective decision-making, let’s consider Swiggy’s example. For an online food delivery platform delivering more than a million orders every day across 500 Indian cities, watching hourly trends would be a herculean task. However, Swiggy could pull it off using data visualization on Power BI. Below is a snapshot of the real-time dashboard they created on Power BI:
Data visualization solves some key challenges in DDDM, such as data complexity and data illiteracy. Beyond offering comprehension, data visualization offers several key advantages. Data visualization allows for the rapid absorption of information, enabling quicker and more informed decision-making. It empowers organizations to gain a clearer understanding of their next steps for growth and development. Moreover, it enhances the ability to engage and retain the interest of diverse audiences by presenting information in a format that is easily digestible.
Data visualization simplifies information distribution, making it easier to share insights with stakeholders, team members, and decision-makers. This accessibility reduces the reliance on data scientists to interpret data, as it becomes more intuitive for non-experts. Consequently, you can act swiftly on insights, leading to faster and more accurate decision-making processes.
Data visualization aids in uncovering the factors influencing consumer behavior, identifying problematic areas that require attention, making data more memorable for stakeholders, pinpointing optimal times and locations for product promotion, and predicting sales volumes. It empowers CXOs to make data-driven decisions that contribute to the overall success of the organization.
Enter Generative AI – the data democratizer
While data visualization helps CXOs understand and communicate data, the integration of generative AI takes data analytics to the next level. Generative AI models, such as GPT-3.5, can generate human-like text, making them invaluable in data analysis and decision-making processes. One best example for generative AI in data visualization is Copilot in Microsoft Power BI. Copilot is a generative AI tool that can enable you to create tailored reports in seconds only by describing the visuals and insights you need.
(Source: https://powerbi.microsoft.com/en-us/blog/introducing-microsoft-fabric-and-copilot-in-microsoft-power-bi/)
Generative AI, when integrated with data visualization tools, can significantly enhance the capabilities of business executives in addressing Data-Driven Decision-Making (DDDM) challenges. Here’s how generative AI complements data visualization, in the context of Power BI Copilot:
Data complexity management
Generative AI algorithms can help simplify complex datasets by automatically identifying patterns, correlations, and anomalies. This simplification can be visualized through interactive charts and graphs in Power BI Copilot. This simplification process allows business executives to quickly grasp the key insights within intricate data, aiding in more efficient decision-making.
Data quality improvement
Poor-quality data can lead to incorrect decisions. Generative AI can assist in data cleansing and imputation, reducing errors in the data. Power BI Copilot can visualize the data quality improvements, highlighting the before-and-after scenarios, making it easier for executives to trust and use the data confidently.
Data literacy enhancement
Data illiteracy can be a roadblock to effective data-driven decisions. Generative AI can generate natural language explanations and insights from the data, making it more understandable to non-technical stakeholders. Power BI Copilot can present these AI-generated insights in an easily digestible visual format, ensuring that executives with varying levels of data literacy can make informed choices.
Advanced predictive analytics
Generative AI can go beyond basic data visualization by generating predictive models based on historical data. These models can predict future trends and outcomes. Power BI Copilot can visualize these predictions through interactive dashboards, allowing executives to explore “what-if” scenarios and make decisions based on future projections.
Real-time insights
Generative AI can continuously analyze streaming data and generate real-time insights. Power BI Copilot can display these insights in dynamic visualizations that update in real time. This feature enables executives to respond promptly to changing market conditions or emerging issues.
Efficiency and speed
By automating data analysis and insight generation, generative AI can significantly reduce the time required to make decisions. Power BI Copilot’s integration of generative AI enables executives to access insights quickly, enabling faster and more informed decision-making.
Quality decision-making
Combining data visualization and generative AI tools like Power BI Copilot empowers executives to make data-driven decisions with greater confidence and accuracy. It ensures that decisions are based on comprehensive data analysis and up-to-date information.
Ready to leverage generative AI in data visualization for DDDM?
Consuming reports from data visualization tools like Power BI is easy. With built-in generative AI capabilities like Copilot, data-driven decision-making is made much easier for executives. However, implementing the data visualization solutions while seamlessly integrating with existing enterprise systems is painstaking.
Don’t worry! At Saxon AI, our efficient team of data experts will do the hard work for you.
Get in touch with us now to explore how you can enhance your decisions with generative AI-powered data visualization.
Follow us on LinkedIn and Medium to never miss an update.