data visualization in finance | Saxon AI
Data Visualization / February, 01 2023

Financial Data Visualization – Can your Finance Teams Master Storytelling?

Finance teams are now data hubs as they need to track and forecast organizational performance regularly. But just storing the data is no longer useful unless you communicate the insights from the data. As per a report from Oracle and AICPA, top-performing finance leaders prioritize financial data visualization over their peers.

Communicating compelling stories around the data elevates the role of finance in strategic decision-making. The ability to help the stakeholders understand the meaning of data, create compelling visualizations and find the information intersection is an important skill required for finance teams.

Why does Financial Data Visualization Matter?

  • As per experts’ opinion at Accenture Finance Review, the finance function is evolving rapidly. They are no longer driven by expense spreadsheets and reporting. Finance teams must be powerhouses for data storytelling and predictive analytics.
  • Experts from Harvard Business Review opine that data visualization is now a must-have skill for every team. Earlier it was reserved for only data-minded managers. Finance teams need to dwell in the data deluge more than everyone to convey the hidden message from the data.
  • Around 65% of the people are visual learners. Data visualization creates a lasting impact on the end user. With financial data visualization, you can improve the data understanding for your team and guide the management team to better decisions.
  • Finance teams can find deeper insights from financial data visualizations. As the data sources and interactive tools within the BI tools improve, the focus shifted to non-financial KPIs too. You need to correlate metrics, reveal hidden insights and provide guidance for future actions to improve overall business performance.

 What is Storytelling?

Almost 80% of businesses agree that storytelling is a critical skill to enhance the impact of financial data visualization. Organizations need analysis of data and skills to communicate the data story in a compelling manner. Data storytelling is about effectively communicating insights using clear narratives and appealing visualizations. You can put the context and inspire stakeholders’ action with visual stories.

A few examples

  1. A powerful example from National Geographic is to compare the Covid-19 crisis and the second World War. You can clearly see that when the data is relatable to familiar situations, it helps to envision a reality.
data visualization in finance
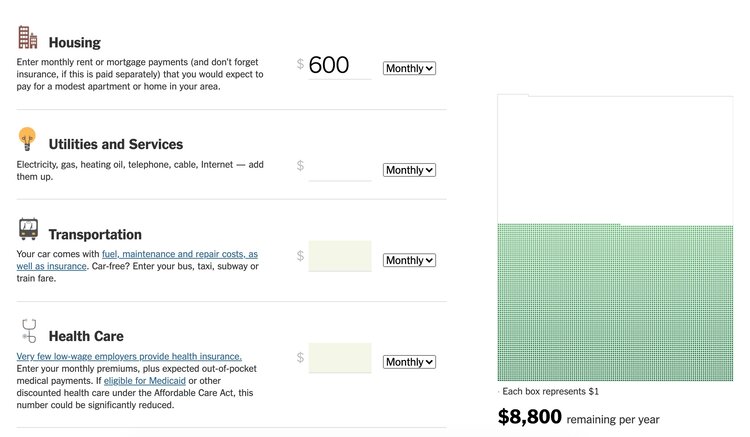
  1. Another example by the New York Times to analyze everyone’s choice, the calculator provides answers to many peoples’ choices. The crux of this is that it conveys a clear message and provides inputs to carry forward.
data visualization in finance

5 Uses of Financial Data Visualization

Every team has different uses for data visualization. Your finance team may not struggle with data preparation, and they can steer the strategic direction. Let us look at a few uses of financial data visualization.

Fraud detection

The first corrective measure can be taken if you can identify fraud at the right time. Fraudulent activities always result in huge losses for businesses. You can flag such transactions with simple data visualizations too. When you can identify consumer behavior in real-time, you can detect anomalies to flag suspicious transactions. Alerting the stakeholders on time to act quickly can help businesses save a lot of money.

Management reporting

Modern businesses need data visualization to identify the performance of different business entities, sales insights, and operating glitches. C-level executives regularly monitor different KPIs for key decision-making. Management reporting is crucial for every organization as you can integrate multiple sources to get a high-level picture. With storytelling abilities, C-suite executives can garner more insights by drilling down further into each parameter.

Financial reporting

Do you think financial reporting differs from management reporting? Yes. You can track the assets and liabilities while also understanding different costs and revenue sources. With the latest advances in BI tools, organizations can customize data visualizations for detailed and real-time analysis of different expenses and other details.

Cash flow analysis

Working capital management is another crucial area as it impacts day-to-day operations. Cash flow analysis will help organizations determine the working capital requirements to run the business. Traditional accounting tools provided this information at the end of the month. But understanding the requirements from different sources helps businesses manage their risks. Data visualization tools now provide 360-degree analysis of the data from multiple sources to proactively monitor business operations.

Forecasting

Organizations in this digital era need to focus on the future while understanding the current business operations. To have a holistic view of finance and predict future business performance, you need to consolidate data from multiple sources. Data visualization will help organizations to predict revenue, sales, expenses, and any Capex requirements.

Points to Consider for Better Storytelling

Finance leaders should consider a few pointers to convey the underlying information from financial data visualization. Let us discuss details about these pointers.

Chose the right tech stack

For better data storytelling, you need to consider investing in data engineering abilities that can integrate data from multiple sources. Also, a central data repository, data management, and self-service BI abilities are the need of the hour. If you choose tools like Power BI, you can use the self-service AI to understand the insights.

Understand the purpose

Before creating any data visualization, understand if the information you have is contextual or data driven. The most important aspect to create lasting impact is to understand the purpose of the visualization. What do you want to accomplish? Is your purpose declarative or exploratory? Do you want to correlate between different parameters? Are you looking for simple answers? All these need to be well thought out before you go ahead with data visualization.

Know your audience

Everyone in your organization does not have the same requirements to understand data visualization. C-suite executives will need insights at a higher level. And most importantly they need them for strategic decision-making. Your operations team may not require these but prefer to understand the in-depth details of each parameter. Why did they go right or wrong and how can they impact business operations?

Enhance the data visualization skills

According to an AICPA report, 60% of finance leaders say that their teams have excellent data visualization skills. On the contrary, only 24% of the users agree that the finance team’s skills are relevant. So always find new ways to enhance your data visualization skills. If you are facing challenges, you can onboard a vendor with end-to-end data engineering and visualization skillset.

Are you looking to create a lasting impact with your data visualization? Contact us to create them in hours and not weeks.

Follow us on LinkedIn and Medium to stay updated about the latest enterprise technology trends. 

Get in Touch

Newsletter

Stay up-to-date with our latest news, updates, and promotions by subscribing to our newsletter.

Microsoft Solutions Partner - Infrastructure (Azure)
Microsoft Solutions Partner - Modern Work
Microsoft Solutions Partner - Data & AI (Azure)
Microsoft Solutions Partner - Business Applications
Microsoft Partner Azure Expert MSP

Copyright © 2008-2023 Saxon. All rights reserved | Privacy Policy

Address: 1320 Greenway Drive Suite # 660, Irving, TX 75038

Archana Aila

Archana Aila

Position Here

With 2 years of hands-on experience in Power Platform, I’ve excelled in developing and implementing solutions for businesses, harnessing the power of Power Apps, Power Automate, Power BI, and Power Virtual Agents to streamline processes and enhance productivity. My proficiency extends to crafting custom applications, automating workflows, generating data insights, and creating chatbots to aid operational efficiency and data-driven decision-making.

With an intermediate knowledge in Azure cognitive services, incorporating them into Power Platform use cases to innovate and solve complex challenges. My expertise in client engagement and requirements gathering, coupled with effective team coordination, ensures on-time, high-quality project deliveries. These efforts have yielded significant accomplishments, solidifying my role as a valuable asset in this field.

Palak Intodia

Palak Intodia

Position Here

I am a tech graduate with a strong passion for technology and innovation. With three years of experience in the IT industry, I’ve been on a continuous journey of professional growth and skill development. My expertise lies in Power Apps and Automate, where I’ve had the privilege of contributing to multiple successful projects.

I’m dedicated to delivering results that not only meet expectations but also drive the success of the projects I’m involved in. I’m committed to my ongoing professional development and the pursuit of excellence.

Roshan

Roshan Jaiswal

Position Here

With nearly 2 years of dedicated experience in Power Platform technology, my expertise lies in crafting customized business solutions using Power Apps and Power Automate. I excel in identifying intricate business requirements and translating them into innovative, user-friendly applications. My daily tasks involve meticulously deploying applications across diverse environments and harnessing the full potential of the Microsoft ecosystem within business applications.

I have proven my adaptability by consistently meeting the demands of creating responsive and scalable applications. Also seamlessly integrating complex workflows and data sources, ultimately enhancing operational efficiency and driving sustainable business growth.

Sugandha

Sugandha Chawla

Position Here

Sugandha is a seasoned technocrat and a full stack developer, manager, and lead. Having 8 years of industry experience, she has been able to build excellent working relationships with all her customers, successfully establishing repeat business, from almost all of them. She has worked with renowned giants like Infosys, Ernst & Young, Mindtree and Tech Mahindra.

She has very diverse and enriching work experience, having worked extensively on Microsoft Power Platform, .NET, Angular, Azure, Office 365, SQL. Her distinctiveness lies in the profound domain knowledge, managerial skills, and process mastery, that she additionally holds, as a result of possessing a customer facing role, working with different sectors, and managing and driving numerous critical executions, single-handedly, end to end.

Vibhuti Dandhich

Vibhuti Dadhich

Position Here

Vibhuti, a Power Platform technology evangelist, has passionately embraced the transformative potential of low-code development. With a background that includes experience at EY and Wipro, she’s been a trusted advisor for clients seeking innovative solutions. Her expertise in unraveling complex business challenges and crafting tailored solutions has propelled organizations to new heights.

Vibhuti’s commitment to staying at the forefront of technological advancements and her forward-thinking approach have solidified her as an industry thought leader. Her mission is to empower businesses to thrive in the digital age, revolutionizing operations through the Power Platform.

Ruturaj Kulkarni

Ruturaj Kulkarni

Position Here

With 8 years of dedicated expertise in the IT realm, I am a seasoned professional specializing in .NET technologies and Microsoft Azure Cloud. My journey encompasses a profound understanding of software development using the .NET framework and a robust command over Azure’s cloud ecosystem. Throughout my career, I’ve demonstrated a knack for crafting scalable and efficient solutions, leveraging the power of cloud computing.

My passion lies in staying at the forefront of technological advancements, ensuring that my skills align seamlessly with the dynamic landscape of IT. Ready to tackle challenges and drive innovation, I bring a wealth of experience to any project or team.